In the realm of web performance, server response time is a critical factor that can significantly influence your site’s overall user experience and search engine rankings. This post delves into what server response time is, how it impacts Core Web Vitals, and what steps you can take to optimize it.
Understanding Server Response Time
Server Response Time (SRT), also known as Time to First Byte (TTFB), measures the duration from when a user’s browser makes a request to your server until it receives the first byte of data. This metric is crucial because it directly affects how quickly content is delivered to users.
Several factors can impact server response time, including:
Server Performance: The efficiency of the server hardware and software configurations.
Network Latency: The delay caused by the distance between the user and the server.
Server Load: The number of concurrent requests being handled by the server.
Database Performance: The speed at which the server can query and retrieve data from the database.
Impact on Core Web Vitals
Core Web Vitals are a set of metrics defined by Google to measure user experience on the web. Server response time affects these Core Web Vitals in the following ways:
LCP: A slow server response can delay the loading of the largest content element on your page, resulting in a poor LCP score. A high LCP indicates that users experience delays in seeing the main content, which can lead to frustration and increased bounce rates.
FID: Although FID is more directly affected by JavaScript execution time, a slow server response can compound delays, making the page seem less responsive to user interactions. Users may experience delays in interacting with elements if the initial server response is slow.
CLS: Server response time indirectly impacts CLS through its effect on page load speed. A slow server can delay the rendering of critical content, causing more layout shifts as the page gradually loads.
How to Check Server Response Time
1. Using Google PageSpeed Insights
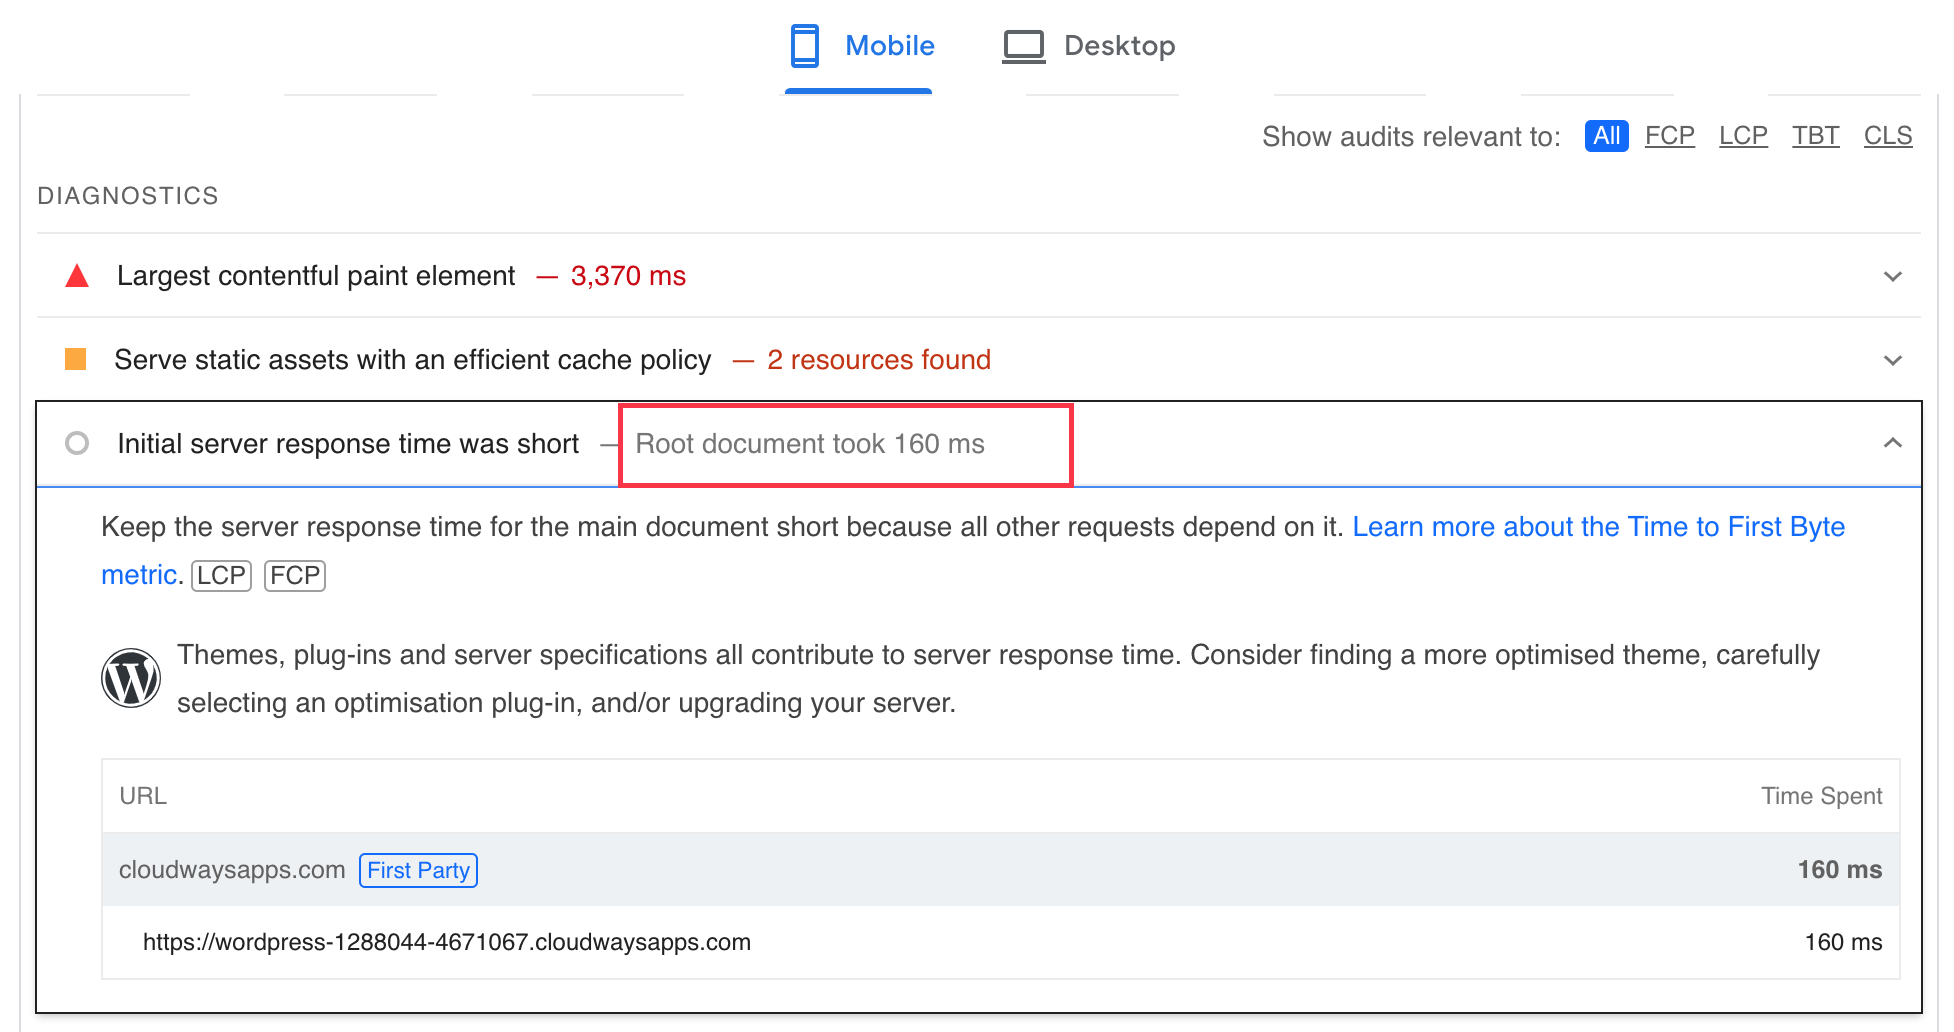
Google PageSpeed Insights provides valuable information on server response time as part of its performance analysis. When you run a speed test, it includes the initial server response time of the tested web page in the report. This metric is essential for understanding how quickly your server begins delivering content.
2. Using Developer Tools
You can also check server response time using your browser’s developer tools. Here’s how:
1. Open Developer Tools: Access the developer tools in your browser (usually by pressing F12 or Ctrl + Shift + C or CMD + Shift + C if you’re using MacOS).
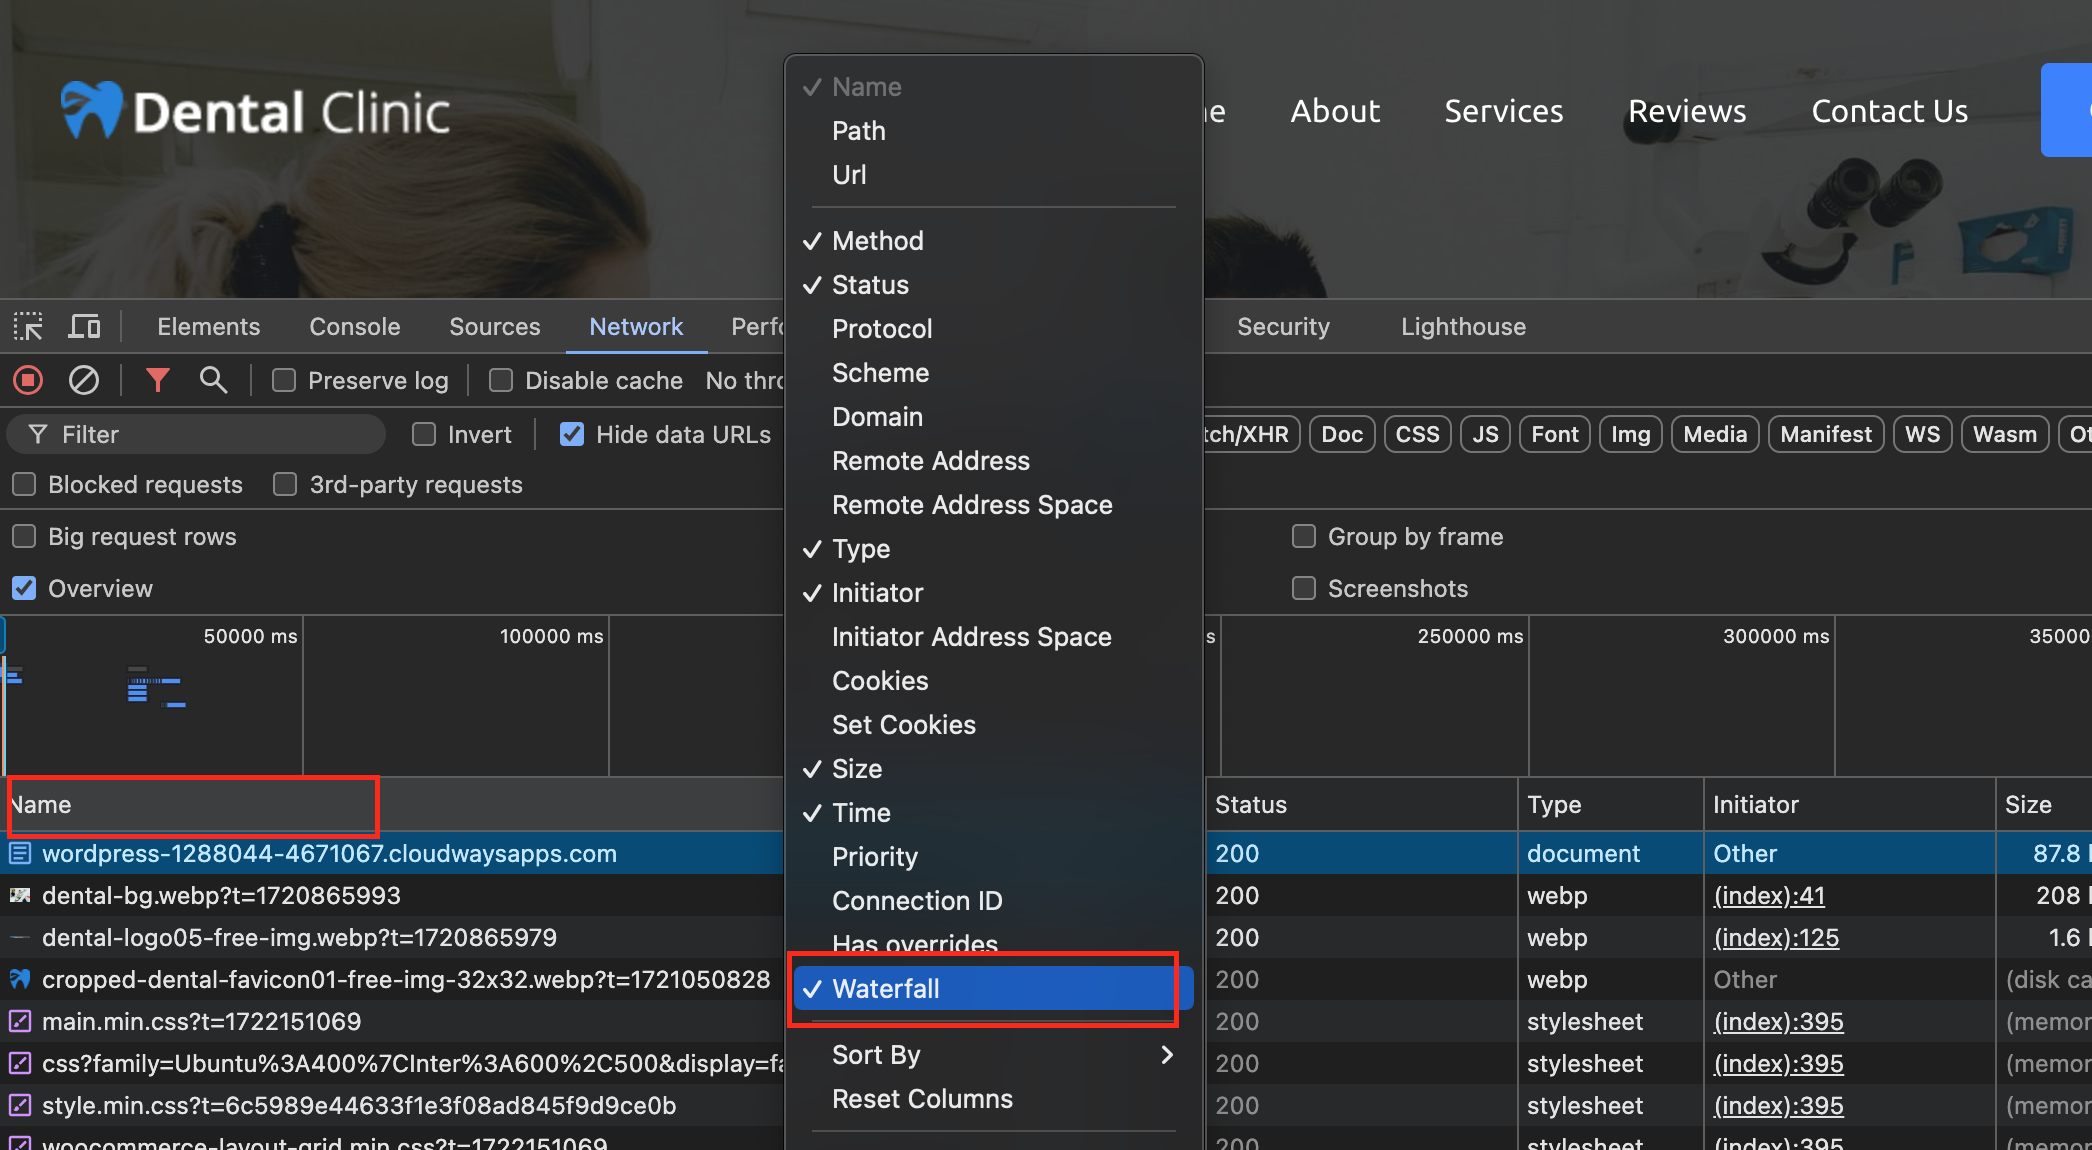
2. Navigate to the Network Tab: Click on the “Network” tab within the developer tools. Right-click on the “Name” column header and ensure the waterfall view is enabled.
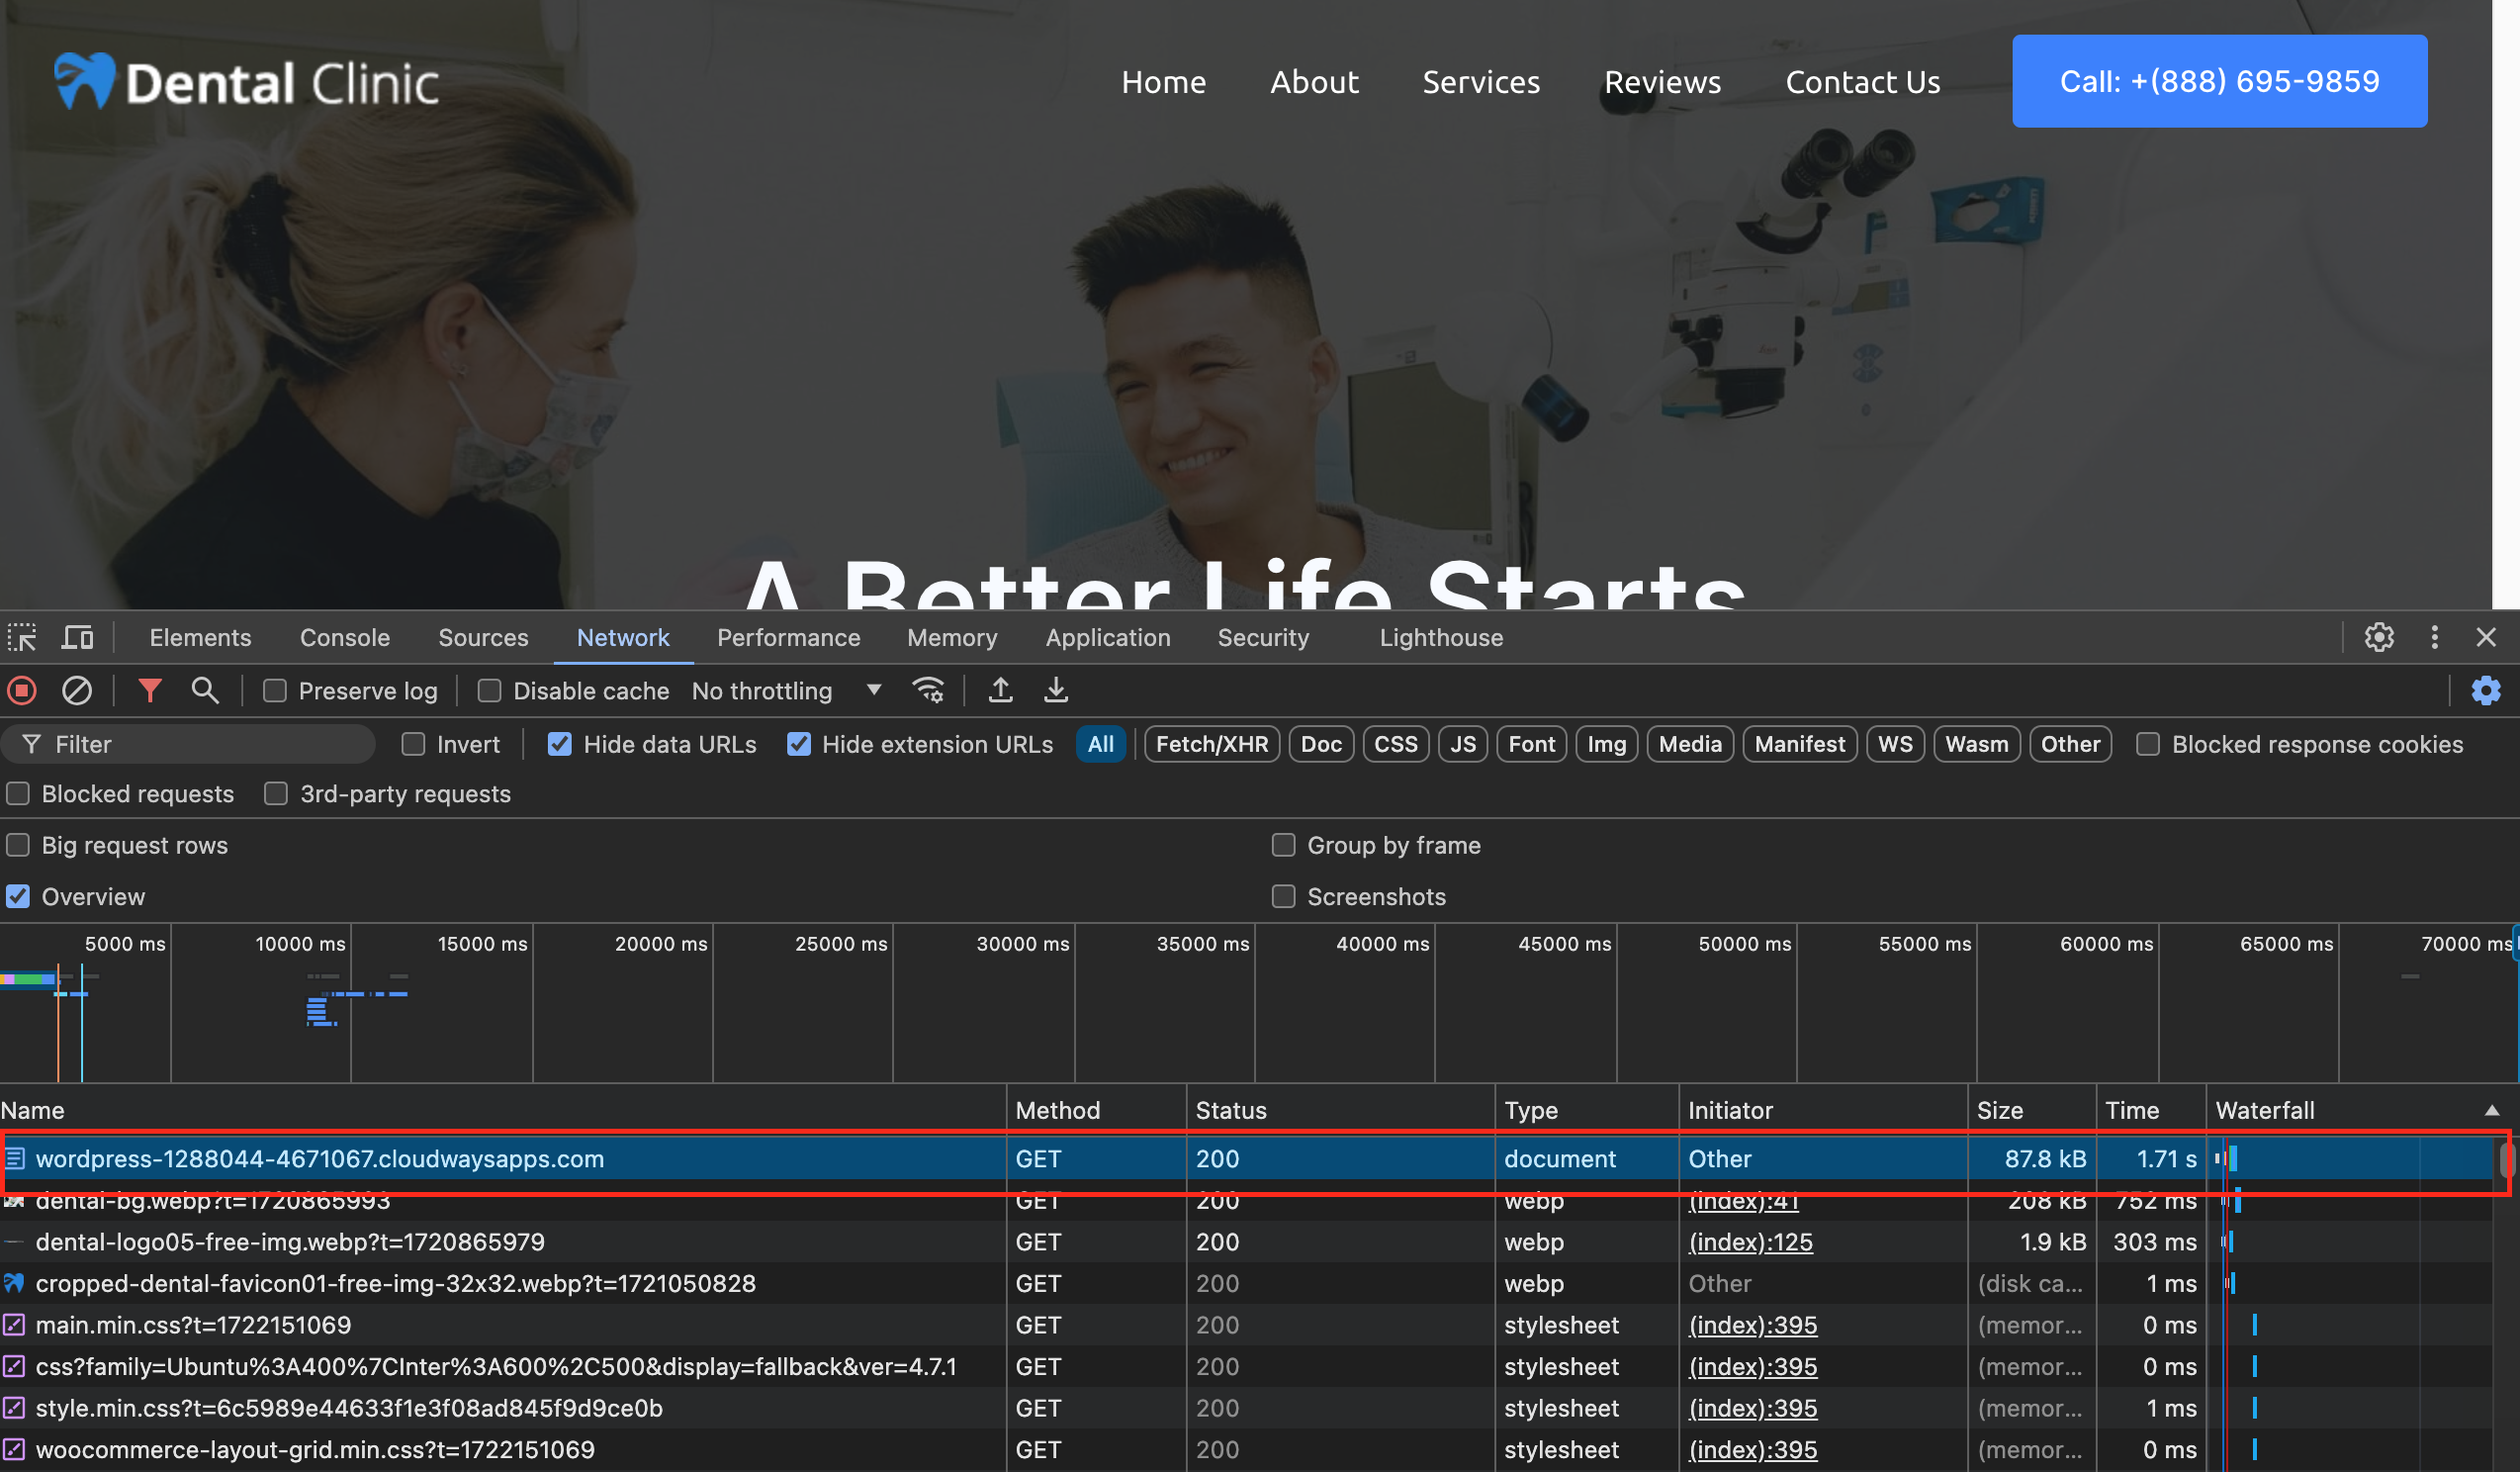
3. Refresh the Page: Press Ctrl + Shift + R to refresh the page and capture a new set of network data.
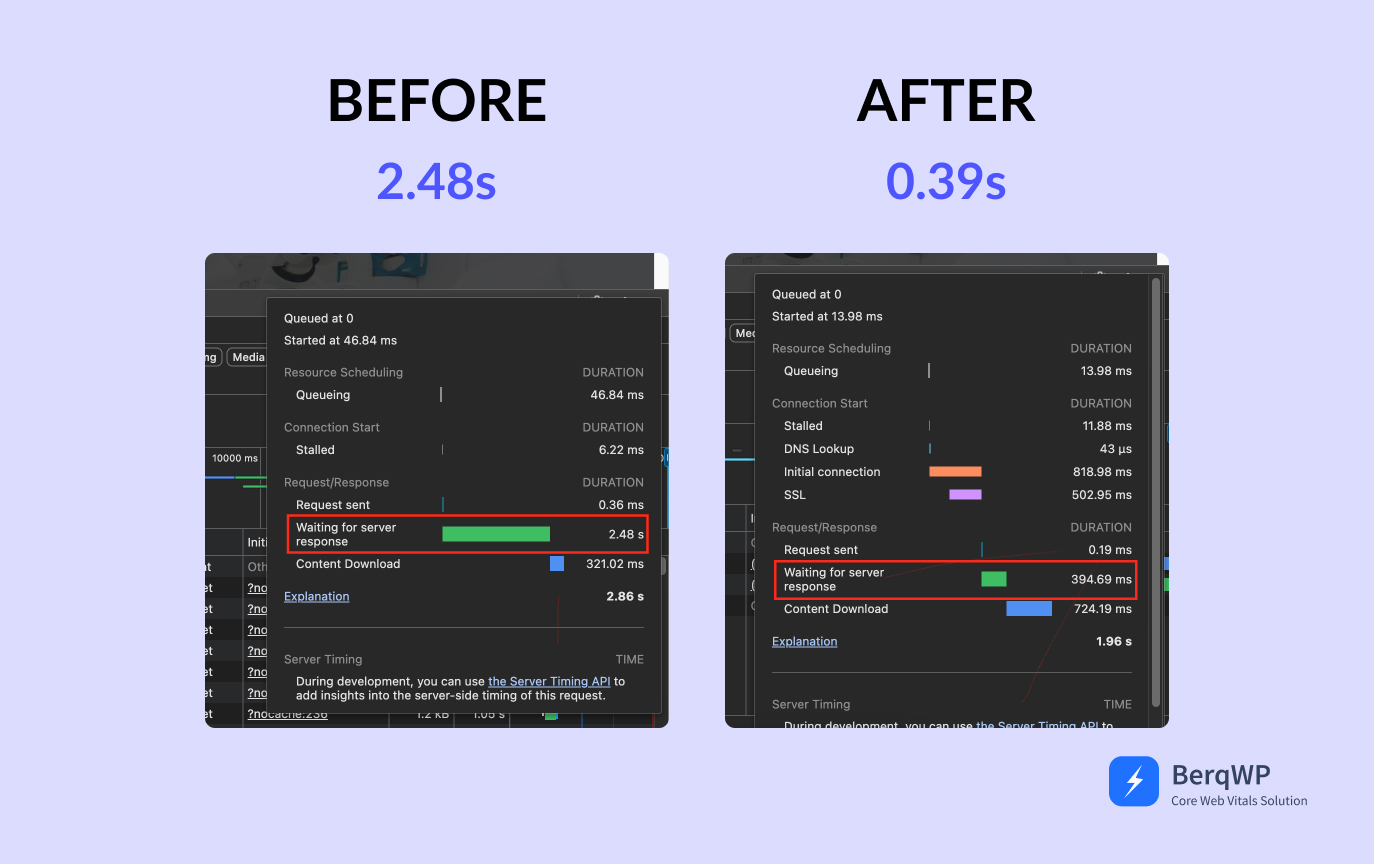
4. Check Server Response Time: Hover over the waterfall graph for your website’s URL. A popup will appear, showing the server response time (Time to First Byte) for the loaded page.
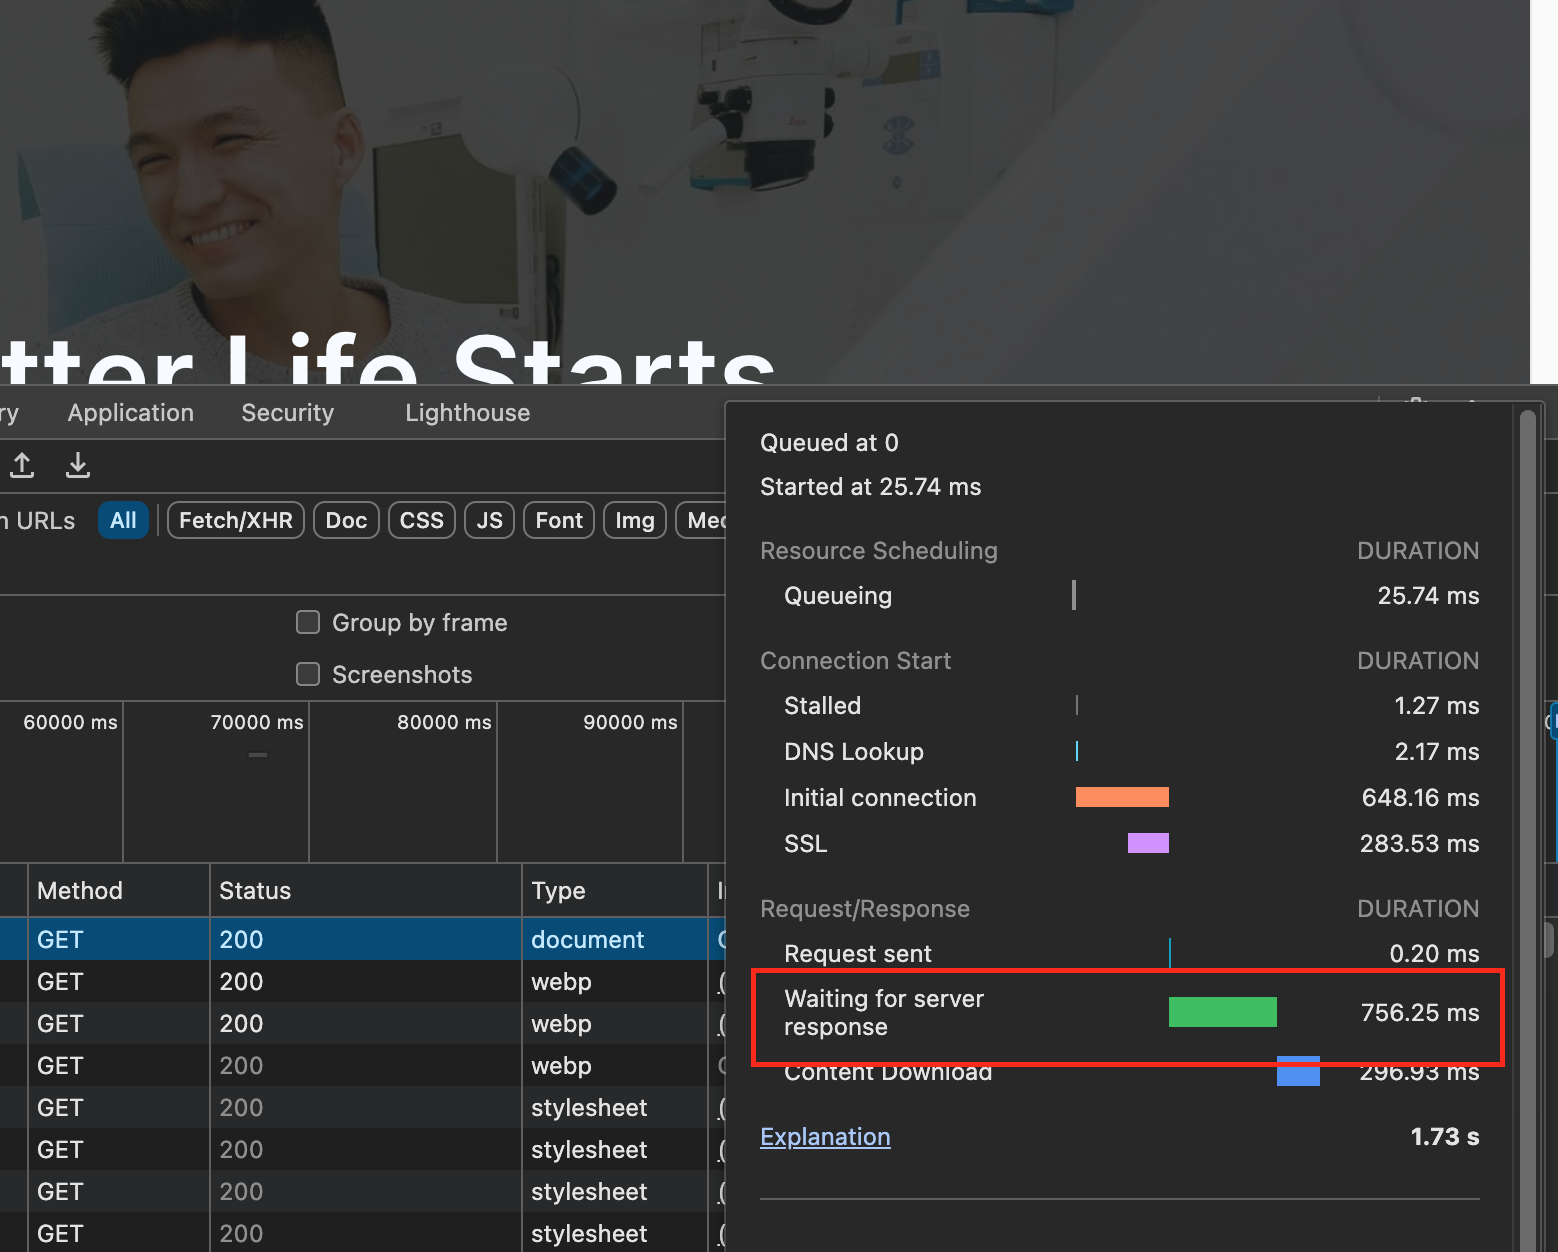
Note: Keep in mind that server response time measured using browser developer tools can be influenced by your network speed. A slower internet connection may result in a higher reported server response time.
Ideal Server Response Time / Time to First Byte
An ideal TTFB should be as low as possible, ideally under 800 milliseconds. This benchmark is based on best practices and industry standards for providing a fast and responsive user experience. A lower TTFB indicates that your server is efficiently processing and responding to requests, leading to faster page load times.
Here’s a breakdown of what constitutes different TTFB performance levels:
Good (0.8 seconds or less): A TTFB of 0.8 seconds or less is considered excellent. This indicates that your server is responding very quickly, providing users with a smooth and fast experience.
Needs Improvement (0.8 – 1.8 seconds): A TTFB within this range is generally acceptable. It shows that the server is performing adequately, though there might be some room for improvement to enhance the user experience further.
Poor (Over 1.8 seconds): A TTFB exceeding 1.8 seconds is considered poor. This suggests that there are significant delays in server response, which can negatively impact page load times and user satisfaction. This often points to underlying issues with server performance, load, or configuration.
How to Reduce Server Response Time / Time to First Byte (TTFB)
High server response time, or Time to First Byte (TTFB), is often caused by factors such as the use of too many plugins or themes and plugins that are poorly coded. Additionally, poor server performance, particularly with shared hosting, can significantly increase TTFB.
To improve server response time, a robust caching solution like BerqWP can make a significant difference. BerqWP drastically reduces server response time through advanced caching methods that minimize database queries and optimize plugin/theme loading processes, resulting in faster cache delivery. This is effective even if you are using shared hosting or poorly coded themes/plugins. The best part is that BerqWP requires minimal configuration compared to other caching plugins—simply install BerqWP and activate the license key, and it will handle all the optimization automatically.
For reference, here’s a comparison of server response times before and after optimizing a website with BerqWP.
Conclusion
Understanding and optimizing your server response time, or Time to First Byte (TTFB), is crucial for enhancing your website’s performance and user experience. A low TTFB ensures that your server is processing and responding to requests efficiently, leading to faster page load times and a better overall experience for your visitors.
By identifying the factors that contribute to high TTFB, such as poorly coded plugins or inadequate server performance, and implementing effective solutions like BerqWP, you can significantly improve your website’s responsiveness. BerqWP’s advanced caching capabilities simplify the optimization process, providing a seamless and efficient way to enhance server response time without the need for complex configurations.
Prioritizing TTFB not only helps in achieving better PageSpeed scores but also ensures a smoother, faster, and more reliable experience for your users. Keep monitoring and optimizing your server response time to maintain peak performance and stay ahead in delivering an exceptional web experience.

